2026년 AI 인물 검색은 얼마나 발전했을까요? 저희는 이를 알아보기 위해 오픈 소스 벤치마크를 구축했습니다. 채용, 영업, 연구 분야의 실제 실무자 워크플로우에서 추출한 119개의 실제 쿼리를 Lessie, Exa, Claude Code, 그리고 Juicebox 네 가지 플랫폼을 대상으로 테스트했습니다. 모든 결과는 실제 웹 소스를 통해 독립적으로 검증되었습니다. 자가 보고된 데이터나 엄선된 예시는 없습니다.
그 결과, Lessie는 전체 65.2점을 기록하며 네 가지 시나리오 카테고리 모두에서 선두를 차지했습니다. 다음으로 높은 플랫폼은 55점을 기록했습니다. 이 게시물에서는 전체 벤치마크 결과 — 무엇을 측정했고, 어떻게 점수를 매겼으며, 데이터가 AI 기반 인물 검색의 현재 상태에 대해 무엇을 보여주는지 — 를 자세히 설명합니다.
왜 AI 인물 검색이 중요한가요?
AI 인물 검색은 채용, 영업, 연구 팀의 핵심 인프라가 되고 있습니다. 하지만 지금까지는 플랫폼을 비교할 표준화된 방법이 없었습니다. 공급업체들은 검증할 수 없는 정확도 수치를 자체 보고하고, 사례 연구는 가장 좋은 결과만 선별합니다. 이 벤치마크는 이러한 상황을 바꿉니다 — 119개의 실제 쿼리, 독립적인 웹 검증, 그리고 테스트된 모든 플랫폼에 대한 공정한 경쟁의 장을 제공합니다.
플랫폼 비교
119개의 실제 쿼리를 웹 검증을 통해 독립적으로 0~100점 척도로 평가했습니다. 각 플랫폼은 동일한 조건에서 동일한 쿼리를 실행했습니다. 점수는 관련성, 커버리지, 유용성 세 가지 차원에 걸쳐 평균화되었습니다.
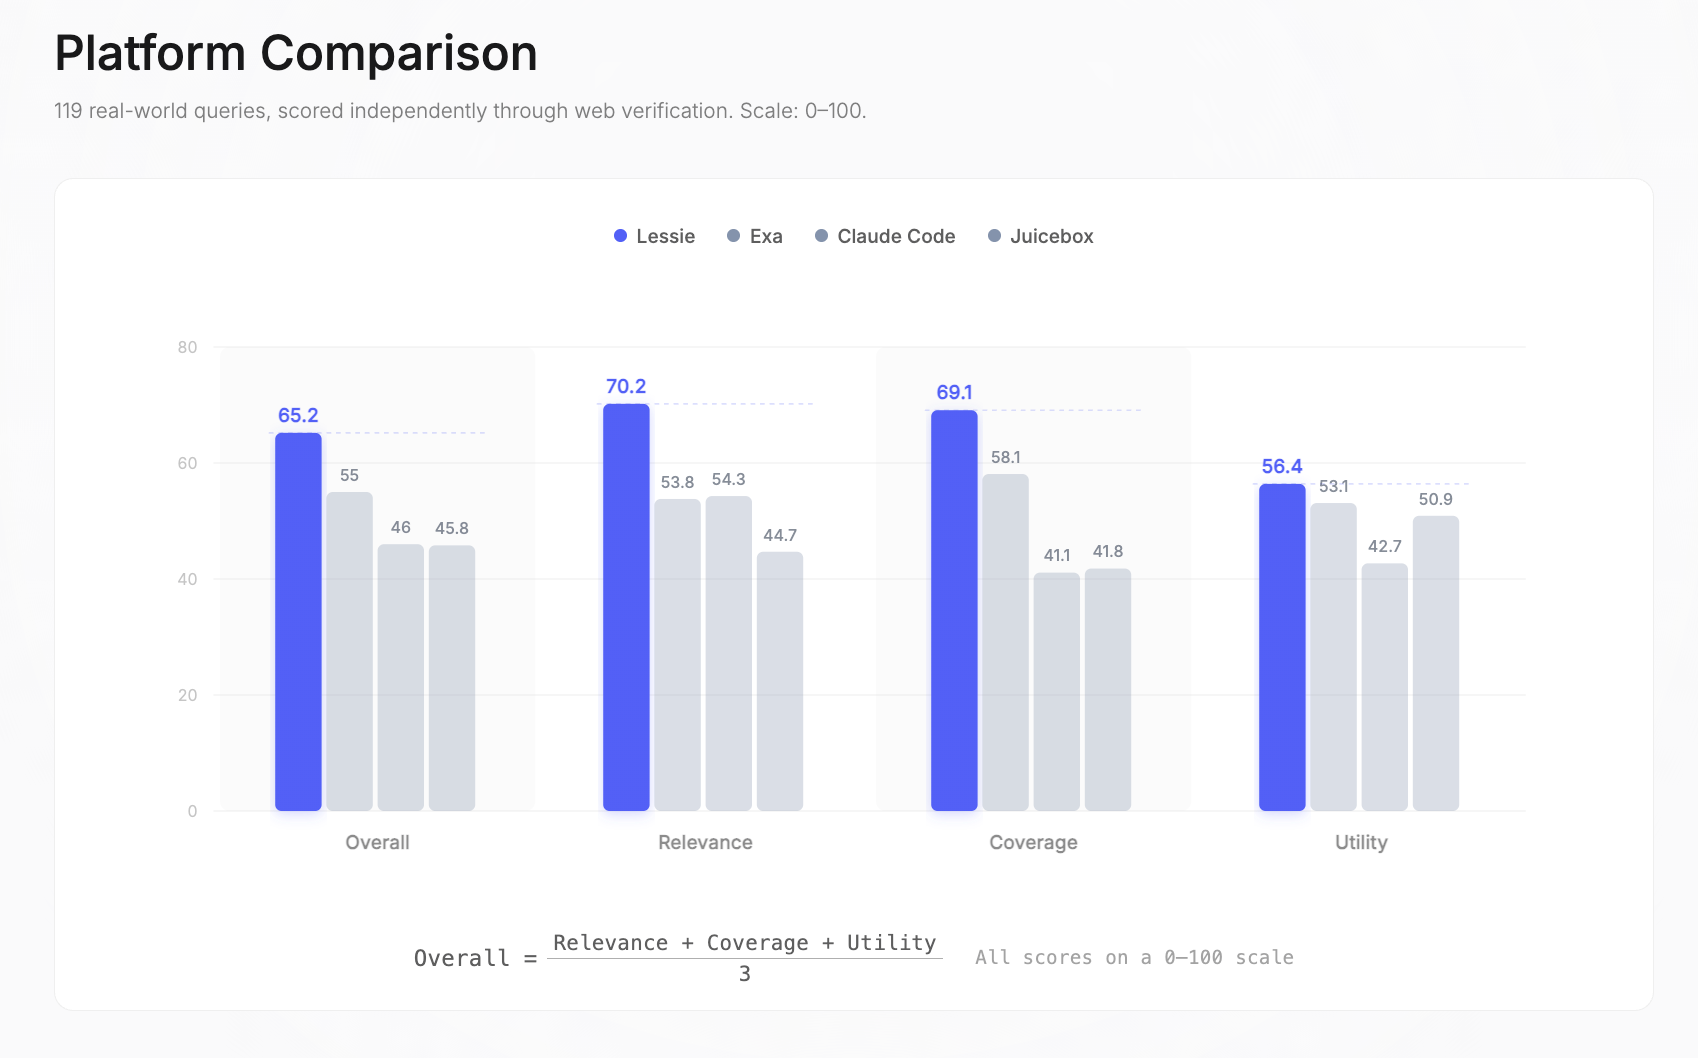
전체 점수: Lessie 65.2 | Exa 55 | Claude Code 46 | Juicebox 45.8. 전체 점수는 관련성, 커버리지, 유용성의 단순 평균입니다 — 각 항목은 0~100점 척도로 독립적으로 측정됩니다.
차원별로 살펴보면: Lessie는 관련성(70.2점, 다음 순위보다 54.3점 높음), 커버리지(69.1점, 다음 순위보다 58.1점 높음), 그리고 유용성(56.4점, 다음 순위보다 53.1점 높음)에서 선두를 차지했습니다. 가장 큰 격차는 관련성에서 나타났는데 — 2위보다 +29% 우위 — 이는 Lessie가 다양한 쿼리 유형에 걸쳐 올바른 인물을 올바르게 순위 매겨 지속적으로 반환했음을 의미합니다.
시나리오별 성능
이 벤치마크는 AI 인물 검색이 비즈니스 가치를 창출하는 네 가지 실제 사용 사례를 다룹니다. 각 시나리오는 서로 다른 워크플로우를 반영합니다: 다른 데이터 소스, 다른 기준 복잡성, 그리고 “좋은” 결과에 대한 다른 정의를 가집니다.
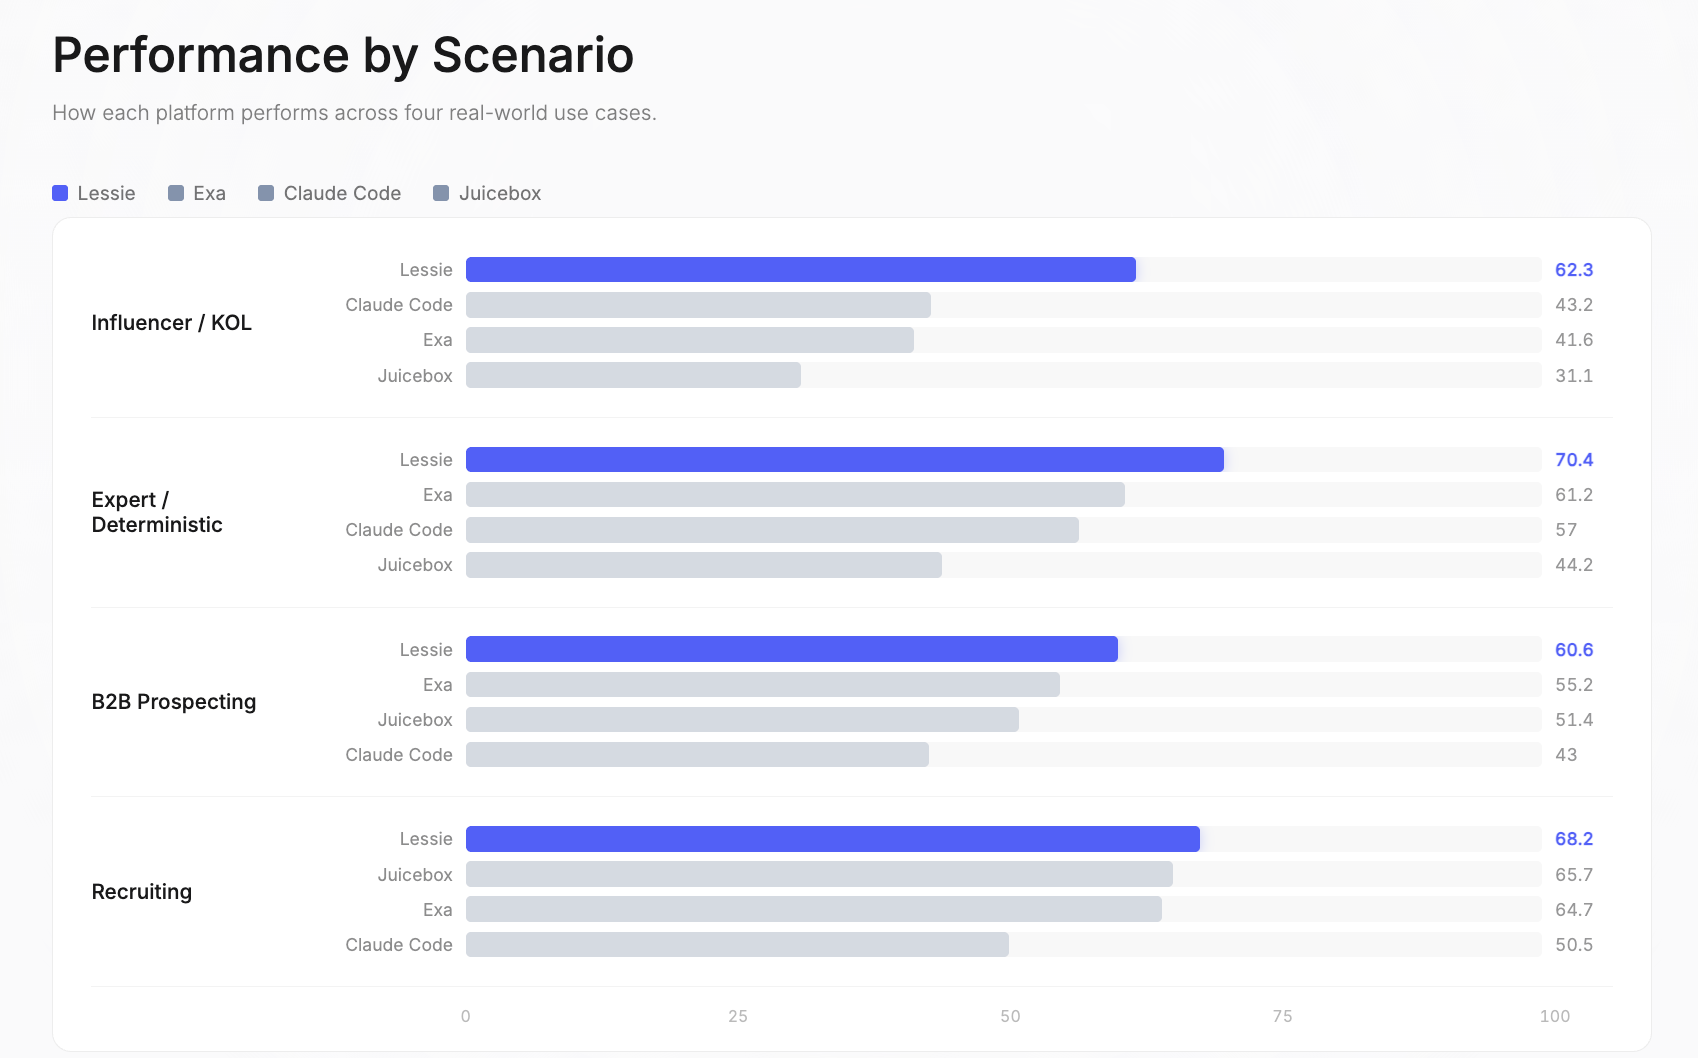
인플루언서 / KOL: Lessie 62.3 | Claude Code 43.2 | Exa 41.6 | Juicebox 31.1. 이는 전체 벤치마크에서 가장 큰 성능 격차였습니다. 단일 소스 플랫폼은 인플루언서가 Instagram, TikTok, YouTube, Twitter, 팟캐스트, 뉴스레터 등 파편화된 소셜 플랫폼에 존재하고, 단일 데이터베이스가 이 모든 것을 커버하지 못하기 때문에 여기서 가장 큰 어려움을 겪습니다.
전문가 / 확정적: Lessie 70.4 | Exa 61.2 | Claude Code 57 | Juicebox 44.2. 이 쿼리들은 검증 가능한 정답을 가지고 있거나 특정 도메인 전문가를 찾습니다. Lessie의 하이브리드 검색 전략 — 구조화된 데이터베이스와 실시간 웹 검색을 결합 — 이 가장 정확한 인물을 찾는 데 가장 효과적임이 입증되었습니다.
B2B 잠재 고객 발굴: Lessie 60.6 | Exa 55.2 | Juicebox 51.4 | Claude Code 43. 목표 기업의 의사 결정자를 찾는 것은 가장 일반적인 AI 인물 검색 사용 사례입니다. Lessie의 강점은 여러 데이터 소스를 교차 참조하여 현재 직책과 연락처 정보를 확인하는 데 있습니다.
채용: Lessie 68.2 | Juicebox 65.7 | Exa 64.7 | Claude Code 50.5. 이 시나리오는 가장 경쟁이 치열했습니다 — 세 플랫폼이 전체 64점 이상을 기록했습니다. 채용 쿼리는 모든 플랫폼이 접근할 수 있는 LinkedIn 중심 데이터베이스의 이점을 얻습니다. 여기서의 마진은 벤치마크에서 가장 얇습니다.
시나리오 심층 분석
각 시나리오 점수는 관련성(올바른 인물을 찾았는가?), 커버리지(얼마나 많은 자격 있는 결과를 찾았는가?), 유용성(반환된 데이터가 실행 가능한가?)의 세 가지 독립적인 차원으로 나뉩니다. 다음은 자세한 분석입니다.
인플루언서 / KOL—소셜 플랫폼 전반에서 콘텐츠 크리에이터 찾기
- Lessie: 관련성 65.2, 커버리지 62.8, 유용성 58.9—100% 완료율
- Exa: Lessie 성능의 89.7%
- Claude Code: Lessie 성능의 82.8%
- Juicebox: Lessie 성능의 79.3%
전문가 / 확정적—검증 가능한 답변 또는 특정 도메인 전문가를 찾는 쿼리
- Lessie: 관련성 79, 커버리지 75.2, 유용성 57.1—100% 완료율
- Exa: Lessie 성능의 96.4%
- Claude Code: 100% 완료율이지만 전체 점수는 낮음
- Juicebox: Lessie 성능의 71.4%
B2B 잠재 고객 발굴—목표 기업의 의사 결정자 찾기
- Lessie: 관련성 62.8, 커버리지 63.5, 유용성 55.5—100% 완료율
- Exa: 100% 완료율, 커버리지에서 근접
- Juicebox: Lessie 성능의 84.4%
- Claude Code: 75% 완료율—이 카테고리에서 가장 낮음
채용—특정 기술, 경험, 위치를 가진 후보자 찾기
- Lessie: 관련성 74.8, 커버리지 75.6, 유용성 54.3—100% 완료율
- Exa, Juicebox: 모두 100% 완료율
- Claude Code: 90% 완료율
- 채용은 모든 플랫폼에서 가장 높은 절대 점수를 기록했습니다—이는 AI 인물 검색의 가장 성숙한 사용 사례입니다.
평가 데이터셋
이 벤치마크는 채용, 영업, 연구 분야의 실제 실무자 워크플로우에서 선별된 119개의 쿼리를 사용합니다. 이는 인위적인 테스트 케이스가 아니라 — 전문가들이 인물을 찾을 때 실제로 실행하는 검색을 반영합니다. 데이터셋은 다국어(영어, 포르투갈어, 스페인어, 네덜란드어)이며 실무자 중심입니다.
- 채용 (30개 쿼리): 특정 기술, 경험 수준, 위치를 가진 후보자 찾기
- B2B 잠재 고객 발굴 (32개 쿼리): 영업 아웃리치를 위한 목표 기업의 의사 결정자 식별
- 전문가 / 확정적 (28개 쿼리): 검증 가능한 정답을 가진 쿼리 또는 특정 도메인 전문가 찾기
- 인플루언서 / KOL (29개 쿼리): 틈새 시장, 잠재 고객, 참여도별로 소셜 플랫폼 전반에서 콘텐츠 크리에이터 찾기
세 가지 평가 차원은 검색 품질의 독립적인 측면을 측정합니다: 관련성(순위 품질), 커버리지(결과 볼륨), 그리고 유용성(데이터 완전성). 이들은 결합되어 전체 점수를 구성합니다.
방법론
평가 파이프라인은 완전 자동화되어 재현 가능합니다. 모든 플랫폼의 모든 결과는 실제 웹 소스를 통해 검증됩니다 — 자가 보고된 데이터나 수동 큐레이션은 없습니다.
1단계: 쿼리 분해. “베를린의 시리즈 B 스타트업의 시니어 ML 엔지니어”와 같은 쿼리는 구조화된 체크리스트가 됩니다: 직책, 경력 수준, 도메인, 회사 단계, 위치. 이 분해는 각 결과에 대한 채점 기준을 정의합니다.
2단계: 웹 검증. 모든 플랫폼에서 반환된 모든 인물은 LinkedIn, 회사 웹사이트, 소셜 프로필에 대해 확인됩니다. 자가 보고된 데이터는 없습니다 — 온라인에서 독립적으로 확인할 수 있는 것만 사용합니다. 이는 플랫폼 편향을 제거하고 공정한 비교를 보장합니다.
3단계: 세 가지 축으로 점수 매기기. 관련성(올바른 인물을 찾았는가?), 커버리지(얼마나 많이?), 유용성(프로필 데이터가 실제로 유용한가?). 이 세 가지 점수는 하나의 전체 점수로 결합됩니다: (관련성 + 커버리지 + 유용성) / 3.
측정 항목
관련성—Padded nDCG@10. 반환된 인물이 쿼리와 일치하고 올바르게 순위가 매겨졌는지 측정합니다. 각 인물은 웹 검증을 거쳐 명시적인 기준에 따라 등급이 매겨집니다. 점수는 10개 슬롯으로 패딩됩니다 — 적은 결과를 반환하면 불이익을 받습니다. 이는 상위 결과의 정밀도와 재현율 모두에 보상을 제공합니다.
커버리지—TCR × Yield. 쿼리당 얼마나 많은 자격 있는 인물이 발견되는지 측정합니다. 작업 완료율(플랫폼이 어떤 결과라도 반환했는가?)과 평균 자격 결과 수율(K=10으로 제한)을 결합합니다. 이는 관련 결과의 신뢰성과 볼륨 모두에 보상을 제공합니다.
유용성—(C + E + A) / 3. 반환된 데이터가 완전하고 실행 가능한지 측정합니다. 세 가지 하위 차원을 평균합니다: 구조적 완전성(C), 쿼리별 증거(E), 실행 가능성(A). 이름은 있지만 이메일, 직책, 회사가 없는 프로필은 해당 인물이 관련성이 있더라도 유용성 점수가 낮습니다.
주요 결과
119개 쿼리에 걸쳐 476회 플랫폼 실행 후, AI 인물 검색의 현재 위치와 각 플랫폼이 어디에서 뛰어나거나 부족한지를 보여주는 몇 가지 패턴이 나타났습니다.
- 네 가지 시나리오 모두에서 1위. Lessie는 채용, B2B 잠재 고객 발굴, 전문가 / 확정적, 인플루언서 / KOL 등 모든 카테고리에서 선두를 차지한 유일한 플랫폼입니다. 다른 플랫폼은 두 개 이상의 시나리오에서 1위를 차지하지 못했습니다.
- 100% 완료율. 모든 쿼리가 결과를 반환했습니다. 다른 플랫폼은 이를 달성하지 못했습니다 — 특히 다른 플랫폼이 아무것도 반환하지 못한 틈새 시장 및 추상적인 검색에서 더욱 그렇습니다. 0개의 결과를 반환하는 것은 단일 소스 플랫폼에만 있는 실패 모드입니다.
- 가장 큰 관련성 격차: 70.2점 대 54.3점 (+29%). 순위 품질 차이는 다중 기준 쿼리에서 가장 두드러집니다 — 직책, 경력 수준, 산업, 위치 제약을 결합한 검색입니다.
- 인플루언서가 가장 큰 격차를 보였습니다. Lessie는 전체 62.3점을 기록했으며, 2위는 43.2점을 기록했습니다. 인플루언서 데이터는 수십 개의 소셜 플랫폼에 파편화되어 있기 때문에 단일 소스 플랫폼은 여기서 가장 큰 어려움을 겪습니다.
- 유용성이 가장 치열한 경쟁이었습니다. 프로필 데이터 완전성은 가장 경쟁이 치열한 차원입니다 — 모든 플랫폼이 42.7점에서 56.4점 사이를 기록했습니다. 이 분야는 업계가 개선할 여지가 가장 많습니다.
- 채용이 가장 경쟁이 치열했습니다. 세 플랫폼이 전체 64점 이상을 기록했습니다. 이는 기존 도구가 가장 잘 작동하는 시나리오이며 — 마진이 가장 얇은 곳입니다. LinkedIn 중심 데이터는 모든 플랫폼에 더 강력한 기준점을 제공합니다.
오픈 소스: 전체 평가 데이터셋, 채점 방법론, 플랫폼 수준 결과는 검토를 위해 제공됩니다. 우리는 투명한 벤치마크가 전체 산업을 발전시킨다고 믿습니다.